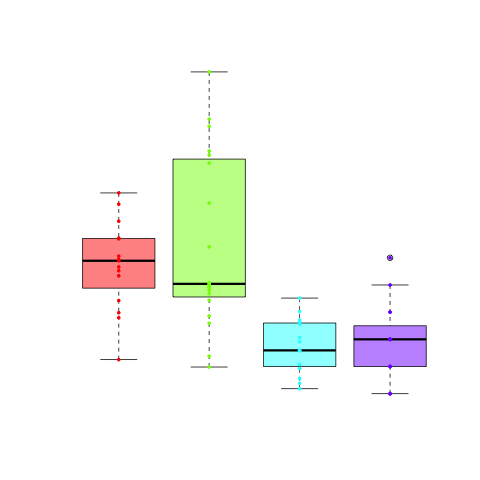
My favorite plots are boxplots, because you have a lot of information in them. If you look at a very basic boxplot, you can see the median (bold line), the quartiles (upper and lower boundary of the box) and if there are outliers (by default those are values that are 1.5 times the boxlength away … Continue reading Create boxplots in R