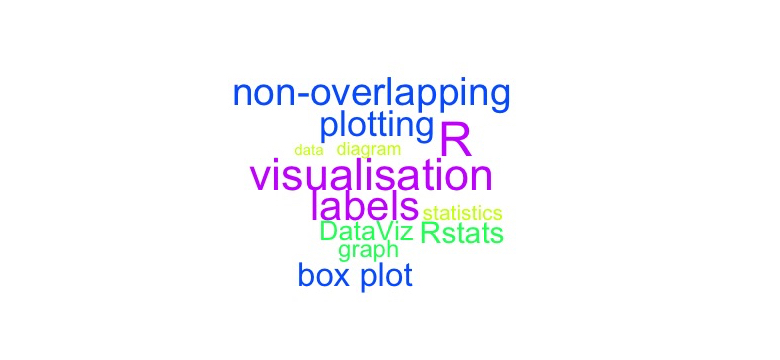
Several times when I create a plot I want to add labels for some dots directly on the plot. For this purpose I have looked for a solution to do this, because implementing it with text would probably take a lot of work. Luckily I found this two links: [stackoverflow] How do I avoid overlapping … Continue reading Add non-overlapping labels to a plot using {wordcloud} in R
Tag: R

what3words in R: threewords V0.1.0 and my own language extension
Recently I scrolled through the list of recently published R packages when something caught my eye: threewords: Represent Precise Coordinates in Three Words which sounded interesting. What is what3words? The about page of their website explains it very well. what3words is an alternative to represent coordinates using exactly three words (instead of GPS coordinates for … Continue reading what3words in R: threewords V0.1.0 and my own language extension
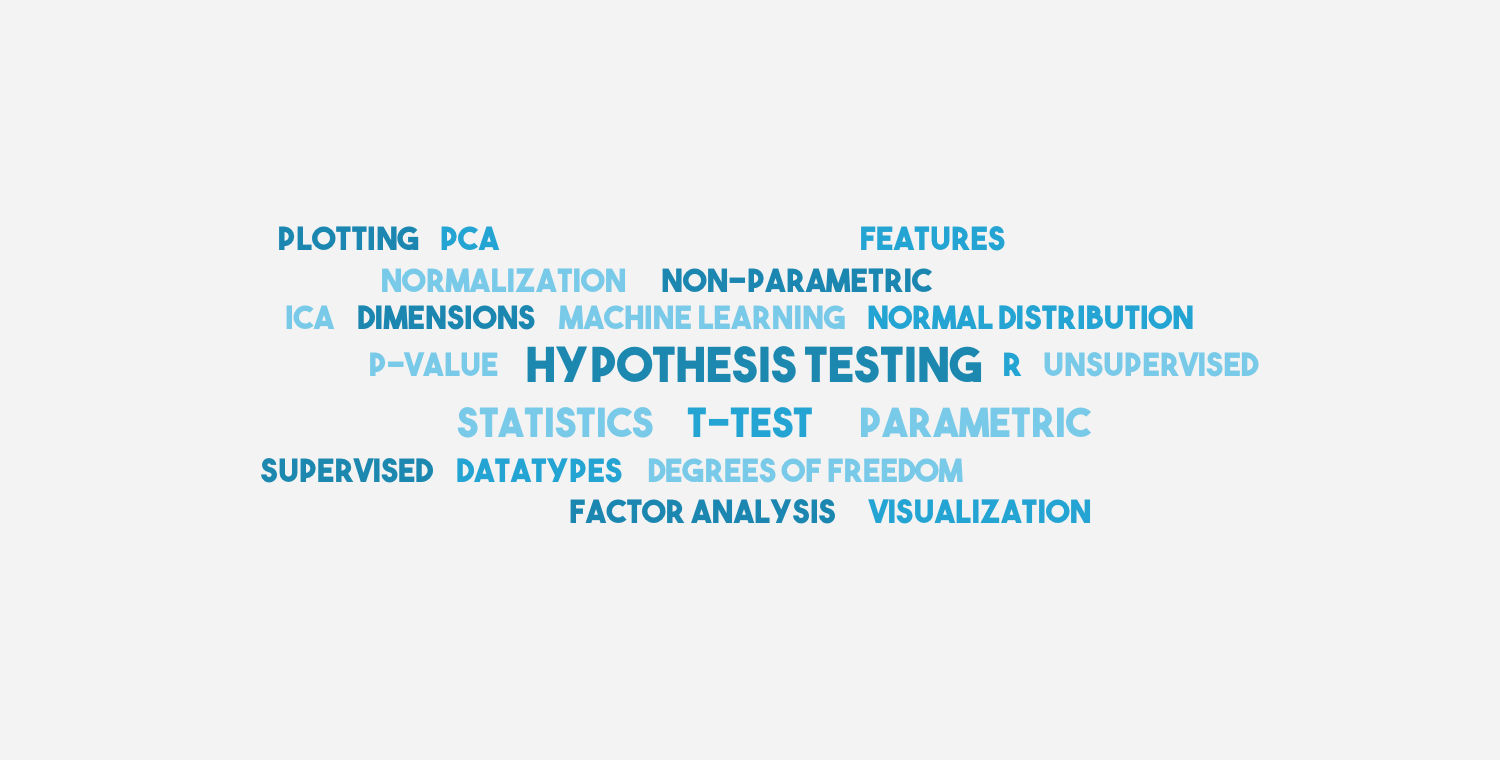
Statistical tests: One sample t-test in R
This is the second post about statistical testing. In the first one I explained the principal concept behind statistical tests. Parametric tests are, in contrast to non-parametric tests, statistical tests that make some kind of assumption about the data. In general parametric tests are used when we assume normality for the source population of our … Continue reading Statistical tests: One sample t-test in R
Debugging in R
During the past few months I have used R and RStudio a lot and since I have implemented some functions that also other people use I found it very useful to know how to debug in R. Debugging is not as convenient or comfortable as in Visual Studio but you can make your life a … Continue reading Debugging in R
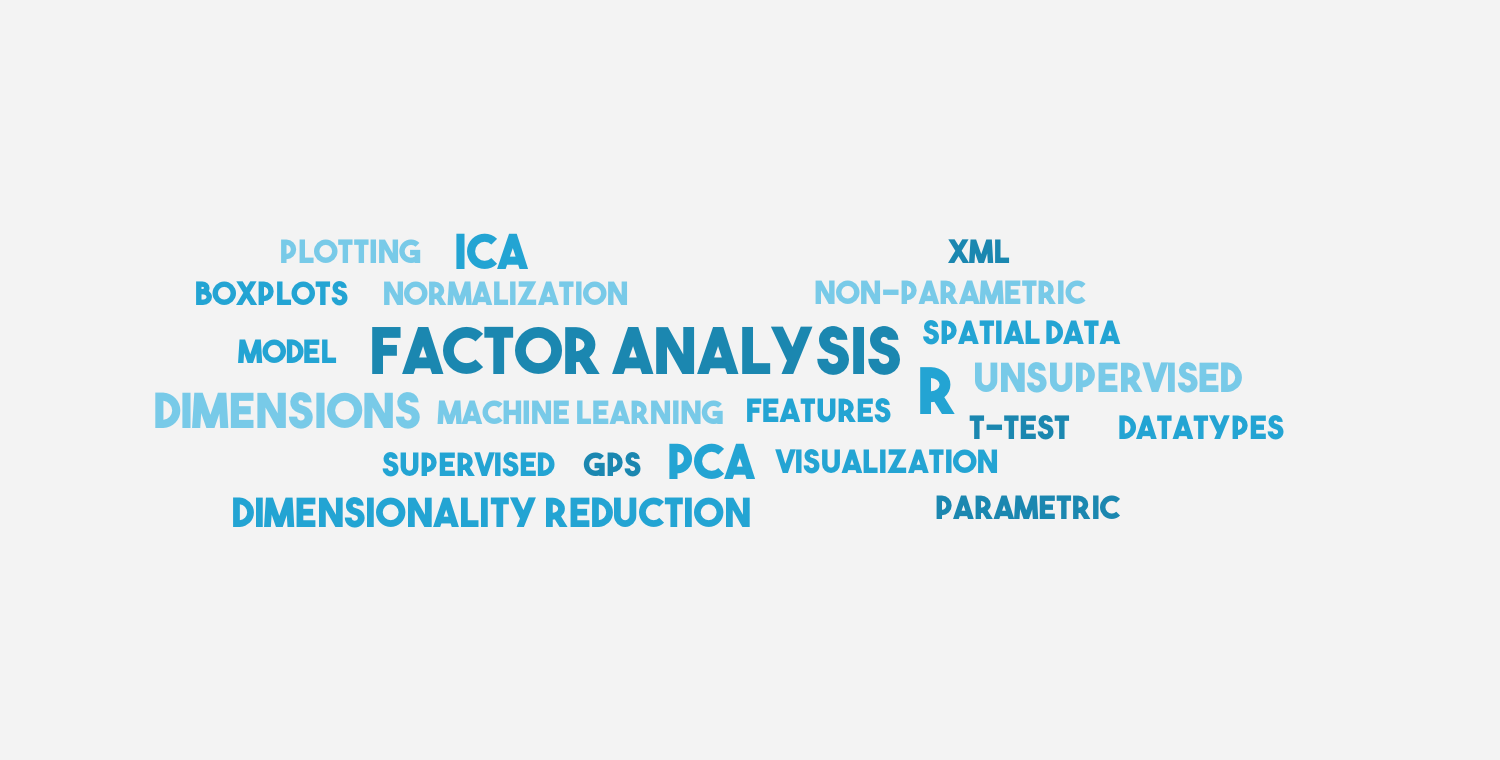
[Dimensionality Reduction #2] Understanding Factor Analysis using R
This time I am going to show you how to perform Factor analysis. In the next post I will show you some scaling and projection methods. The idea for this mini-series was inspired by a Machine Learning (Unsupervised) lecture I had at university. I will perform all this methods on the same data sets and … Continue reading [Dimensionality Reduction #2] Understanding Factor Analysis using R
![[Dimensionality Reduction #1] Understanding PCA and ICA using R](https://www.katzentante.at/wp-content/uploads/2015/05/pca_ica.png)
[Dimensionality Reduction #1] Understanding PCA and ICA using R
This time I am going to show you how to perform PCA and ICA. In the next one or two posts I will show you Factor Analysis and some scaling and projection methods. The idea for this mini-series was inspired by a Machine Learning (Unsupervised) lecture I had at university. I will perform all this … Continue reading [Dimensionality Reduction #1] Understanding PCA and ICA using R

Basic handling of spatial data (like GPS coordinates)
This week I am going to show you some very basic things you can do with GPS coordinates. In this post you will learn how to: Read gpx files Read files containing plain text coordinates (like N 48 12.123 and N 48 12′ 123″) Parse characters string that contain unformatted coordinates (like above) Convert minute … Continue reading Basic handling of spatial data (like GPS coordinates)
How to choose the correct plot for your data
Today I am going to talk about how to choose the correct representation for several types of data. From statistics class you might remember there are three types of data: Metric (data can be measured or counted, mathematical operations make sense) Ordinal (data can be ordered in a meaningful way, but mathematical operations (+, -, … Continue reading How to choose the correct plot for your data
How to handle factors in R
Many people seem to have a problem with factors. This might be because factors do not always behave like you expect them to. Factors are vector like objects, but the items can only take certain values. This post gives a very basic introduction to factors. Introduction and usage Factors can be created from vectors. chr.v … Continue reading How to handle factors in R
Info graphic for R plotting parameters
Do you always have to look up the numbers of plotting symbols or lines? I do and that is why I created an info graphic that summarizes these parameters and also some color functions. You can download this graphic here. The numbers on the axes give the value used for pch and lty according to … Continue reading Info graphic for R plotting parameters