My favorite plots are boxplots, because you have a lot of information in them. If you look at a very basic boxplot, you can see the median (bold line), the quartiles (upper and lower boundary of the box) and if there are outliers (by default those are values that are 1.5 times the boxlength away from the box), they are visible as dots.
The code for this blog post can be found in boxplot.R.
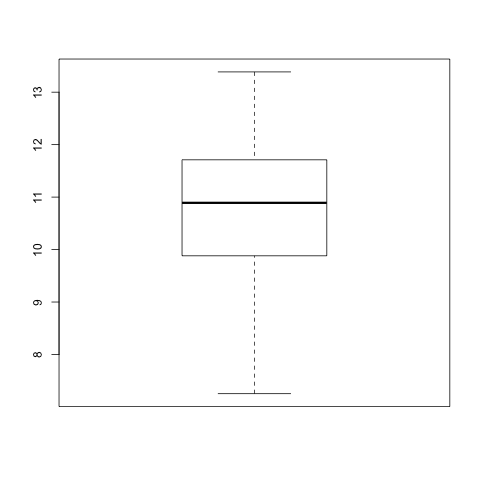
The data used in this example is
r1<-rnorm(15, 10, 2)
r2<-rnorm(20, 12, 3.5)
r3<-rnorm(15, 8, 1)
r4<-rpois(15, 9)
This information can also be obtained by:
summary(r1)
   Min. 1st Qu.  Median    Mean 3rd Qu.    Max.
  7.253   9.882  10.890  10.730  11.710  13.390
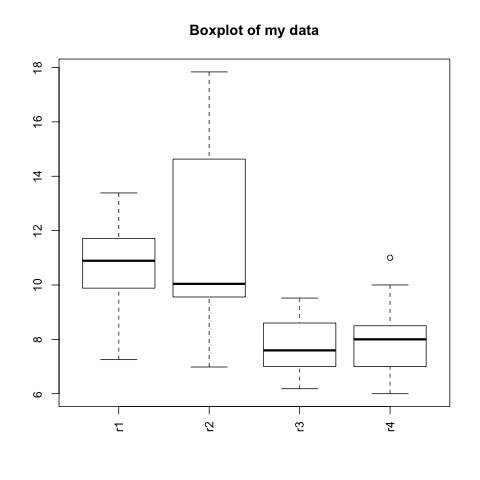
You can not just plot one dataset, but look at several datasets at the same time.
boxplot(r1, r2, r3, r4)
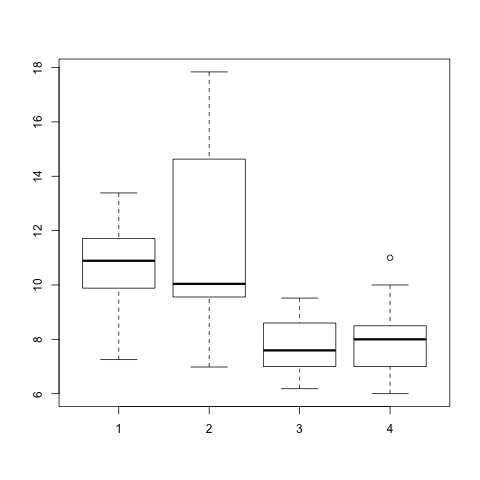
You could also use a dataframe instead of multiple vectors (there are several examples on the internet). Dataframes usually contain paired data (e.g. different features of the same samples). This does not make any sense here, because my data is not paired (which is highlighted by the fact that each vector contains a different amount of points). For paired data a parallel coordinates plot, might sometimes be more useful.
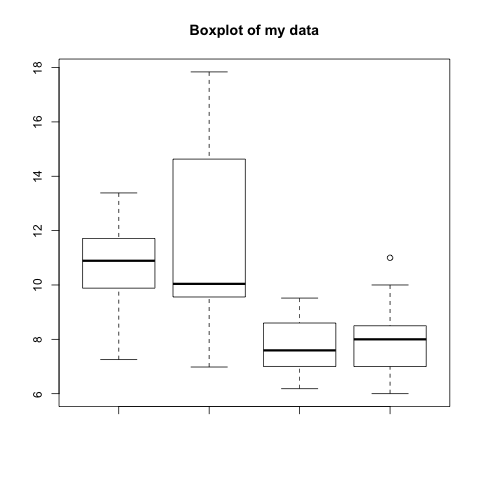
You can add a title to a boxplot (like to any other plot).
boxplot(r1, r2, r3, r4, main="Boxplot of my data")
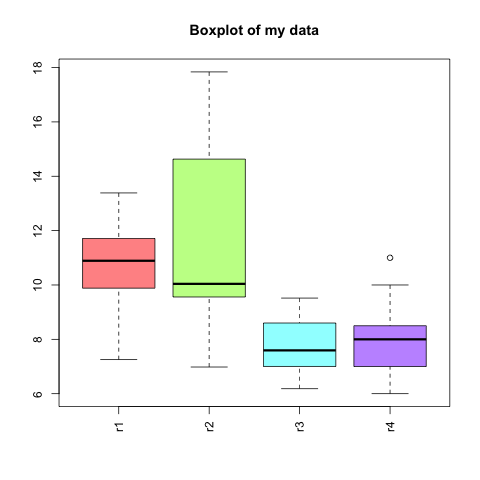
You can also modify the x-axis by first suppressing it with xaxt="n" and then adding it with the axis() command:
boxplot(r1, r2, r3, r4, xaxt="n", main="Boxplot of my data")
axis(side=1, las=2, at = 1:4, labels=c("r1", "r2", "r3", "r4"))
The parameters are as follows:
- side: tells the axis it has to be on the bottom of the plot
- las: specify that the labels are turned by 90°
- at: positions of the labels
- labels: names of the labels
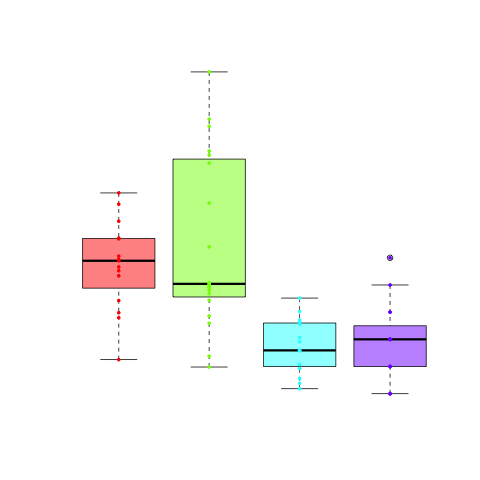
Furthermore, you can give each box a color:
boxplot(r1, r2, r3, r4, xaxt="n", main="Boxplot of my data", col=rainbow(4, alpha = 0.5))
axis(side=1, las=2, at = 1:4, labels=c("r1", "r2", "r3", "r4"))
Here, rainbow() is a special function that returns n colors of the rainbow. The parameter alpha sets the transparency.
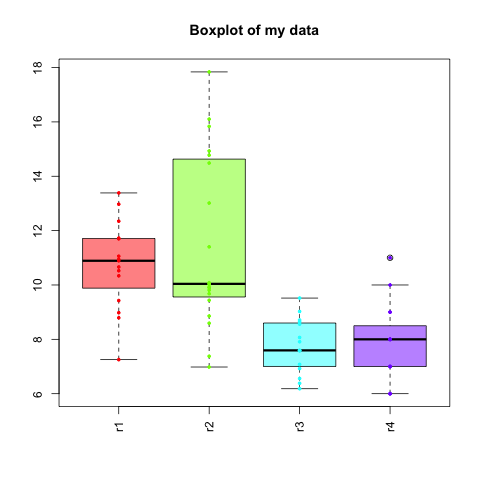
To add more information to the plot, you can even add each single data point.
frequencies<-c(rep(1, length(r1)), rep(2, length(r2)), rep(3, length(r3)), rep(4, length(r4)))
points(frequencies, c(r1, r2, r3, r4), col=rainbow(4)[frequencies], pch=19, cex=0.5)
frequencies contains the numbers 1 to 4 (positions of the 4 boxes) as often as many data points each box contains. This is achieved by rep(1, length(r1)). The points() function uses frequencies as x and the combined c(r1, r2, r3, r4) as y. frequencies also serves another purpose, it can be used as indeces for the rainbow function, such that it selects the right color for each point.
Some additional parameters are:
- pch: Sets the symbol used for points.
- cex: Changes the size of the symbol.
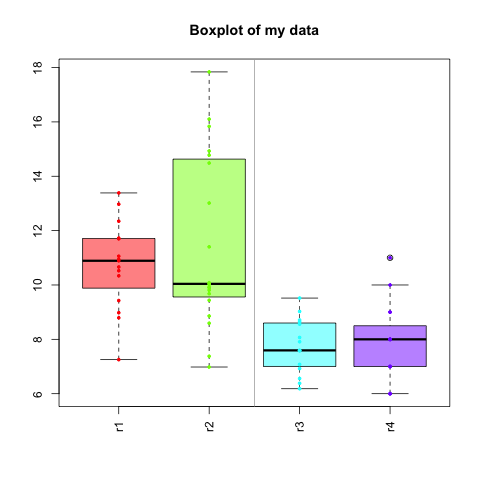
In case you want to add visual separation between some boxes, you can add:
abline(v=2.5, col="darkgrey")
Simply remember that the boxes are one unit apart. I chose darkgrey because it looks a lot nicer than a black line.
This is just the surface of what you can modify for boxplots, but these are crucial things to summarize data. For more parameters check out the help pages of boxplot and bxp (which is the underlying function for boxplots):
?boxplot
?bxp
Some parameters of boxplot which are pretty useful but you might not think of, are:
- range: This defines how far the whiskers reach outside the box, the default is 1.5. I am not mentioning this because you should change it, but because you should be very careful. In the statistics community everyone is used to a value of 1.5, so if you change it you should definitely make sure to mention it. Better don't change it.
- width: Width of the boxes. Is vectorized, so you can use a different with for each plot if you like.
- plot: set to FALSE, it only returns the summary produced by the plot
- pars: additional parameters that are passed to bxp
- horizontal: display the boxplots horizontal instead of vertical
- add: add boxes to an existing plot instead of creating a new one
- at: you can decide where to put the boxes instead of simply adding them at 1:n
Happy plotting!