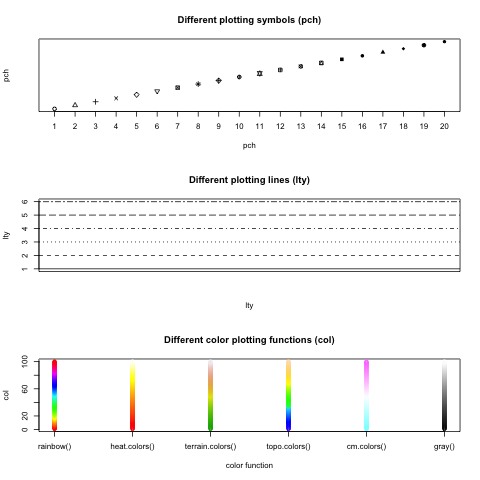
Do you always have to look up the numbers of plotting symbols or lines? I do and that is why I created an info graphic that summarizes these parameters and also some color functions. You can download this graphic here. The numbers on the axes give the value used for pch and lty according to the points / lines.
Below you can find the code for this graphics and some additional hints. If you want other things added to the info graphic, just tell me in the comments! 🙂
# create figure with space for 3 plots
par(mfrow=c(3,1))

# plot 20 available plotting symbols
plot(1:20, 1:20, pch=1:20, main="Different plotting symbols (pch)", xlab="pch", ylab="pch", yaxt="n", xaxt="n")
axis(1, at=1:20, labels=1:20)

# plot 6 available line types
plot(1:6, col="white", main="Different plotting lines (lty)", xlab="lty", ylab="lty", xaxt="n")
abline(h=1:6, lty=1:6)

# plot 6 different color functions
plot(rep(1, 100), 1:100, xaxt="n", xlim=c(1, 6), ylim=c(1, 100), pch=19, col=rainbow(100), main="Different color plotting functions (col)", xlab="color function", ylab="col")
points(rep(2, 100), 1:100, col=heat.colors(100))
points(rep(3, 100), 1:100, col=terrain.colors(100))
points(rep(4, 100), 1:100, col=topo.colors(100))
points(rep(5, 100), 1:100, col=cm.colors(100))
points(rep(6, 100), 1:100, col=gray((1:100)/100))
axis(1, at=1:6, labels=c("rainbow()", "heat.colors()", "terrain.colors()", "topo.colors()", "cm.colors()", "gray()"))
You might note several different things here:
- par(mfrow=c(3,1)) can be used to create a figure containing of several plots. par also has many other parameters to modify plots.
- I have removed the original axis from the first plot (xaxt=”n”) and added a customized axis.
- I use abline() to add a horizontal line to the plot. It can also be used to create vertical lines or slopes. Also check out method lines().
- The first five color methods take the parameter n, which creates n different colors and returns them as a vector. If there are too few colors, the plot function recycles them. The function gray() takes only values between 0 and 1 and returns one gray value. That’s why I pass a vector of values between 0 and 1 to get a vector of gray values.