
In a recent blog post I evaluated the R package lime on a regression data set. After this I wanted to go deeper (pun not intended ;)) and use lime on more complicated models such as deep neural networks. I have started collecting cat and dog pictures a long time ago with the idea in mind to use them for machine learning at some point. Since the dataset is probably not large enough (“only” a few hundred pictures) and the animals are not very diverse (basically many pictures of a few different cats and dogs) I never trained a classifier so far. For the task I came up with it was perfect though. I wanted to use a classifier trained on a larger cat and dog dataset and evaluate it on my independent image set. I wanted to answer two questions:
- How will the classifier perform on my photos?
- Can I explain why the classifier works (or does not work) on my images?
Contents
The model
At first I tried a few models I found online (I’m really not an expert in image classification) but the first ones did not work at all. Later on I found an implementation of a CNN (convolutional neural network) that worked quite OK for my purpose. You can probably get a higher accuracy than 80-85% on this data set but a few misclassifitations are probably quite interesting for the analysis.
I reorganized the code from the Kaggle kernel to only leave the interesting parts in my notebooks. I also split the code from the notebook into a training and analysis notebook, since for this blog post I’m mostly concerned with analyzing the model. The initialization code and the code for training can be found in the following files:
The data
Additionally to the Dogs vs. Cats dataset from Kaggle I used some of my own cat and dog pictures. Check out their cuteness below 😉


Analysis of the network
The major part of my blog post will be about the analysis of the cat/dog classifier. For analysing the performance I used a subset of the data from Kaggle (of course I didn’t use that part for training) and my own images. The reason I chose my own images is that you never really know how diverse the training and test data are and the interesting part will be how well the model will perform on really independent and unseen data. For example with images, I can imagine, that even if the creator of the dataset tries to collect many different images, some characteristics might be specific to this data set, e.g. the angle from which you take the picture, the lighting, the colors of your camera, etc. And this might make it harder for the machine learning model to perform well on pictures taken by someone else who is using a different camera in a different environment, etc.
All the code and output can be found in analyse-cat-dog-classifier.ipynb.
Performance comparison
At first I did a comparison of the model performance on the two datasets. For this I computed the confusion matrices of the classifications and the accuracy. What I think is interesting is that the model tends to predict dogs more often than cats (in both datasets). This can also be seen in the example images displayed in the notebook. This is especially interesting because in the training data the number of cats and dogs is completely balanced.
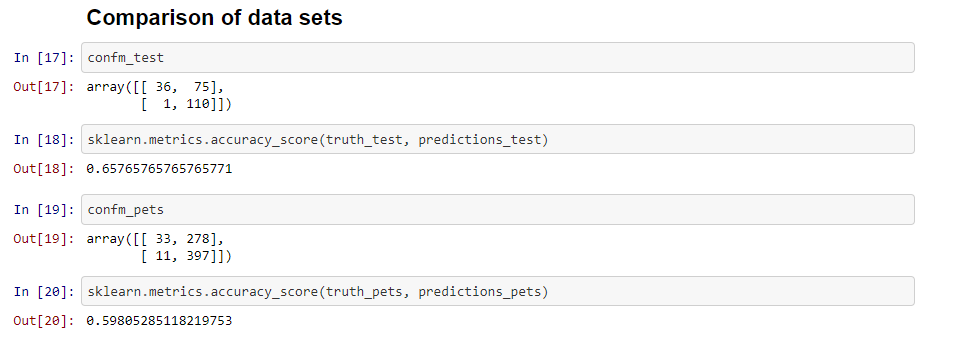
The accuracy on the test set is 65.8% and 59.8% on my own pet images. The performance on both datasets is actually not very good, but slightly better for the test set created from the Kaggle data, so my images seem to be more difficult. People should keep this in mind when using a model that has been trained on data that might be different from new data. Some research is dedicated to this topic and good entry point is the book Dataset Shift in Machine Learning.
Local Interpretable Model-Agnostic Explanations
Unfortunately the model performance is not very good, so instead of checking if the correct predictions also make sense, I was just looking into how to use lime (Python).
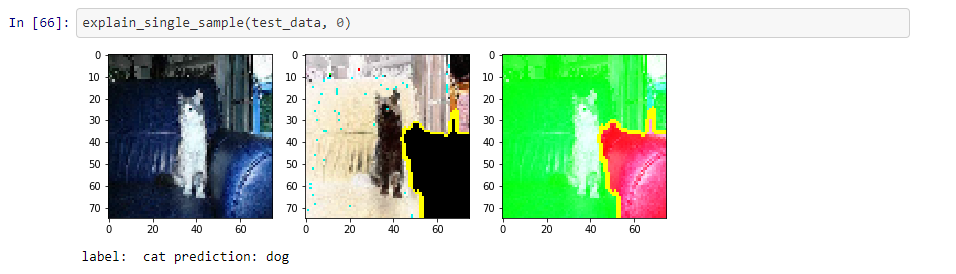
I randomly picked a few samples (more are displayed in the Notebook) and computed the explanations and plotted the masked images. For each sample three images are shown ((a) the image used as input for the neural network, (b) a mask hiding the irrelevant parts and (c) an image showing the ‘pros’ and ‘cons’). For this article I picked three cases:
(1) An image that shows a cat but is misclassified as a dog.
The explanation splits the image in two parts. The green part, which contains the cat and other irrelevant stuff, supports the prediction “dog”. The small part containing part of a couch contradicts the prediction.
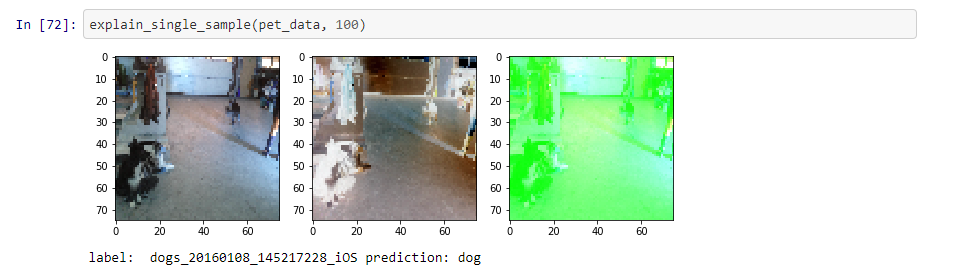
(2) An image of a dog that is correctly classified.
The classification is correct and everything is green. It’s still weird that everything seems to support “dog”.
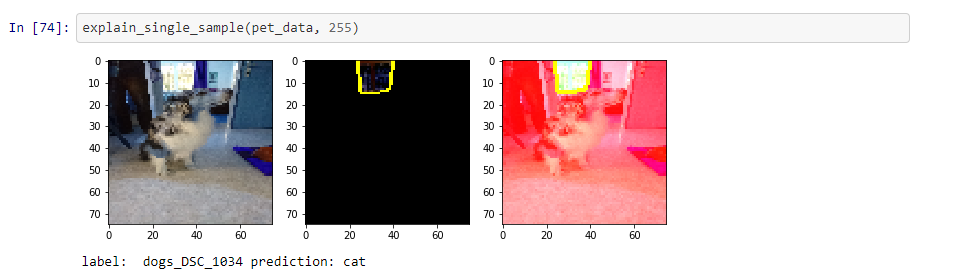
(3) An image that shows a dog but is misclassified as a cat.
This image is especially weird. The classification is wrong and the major part (also containing the dog), contradicts the prediction “cat”. Only a very small part of the image (looks like a window) seems to support “cat”.
Remarks on the LIME explanations
Using the settings I did (num_features=20) I actually expected more fine grained segmentation and in consequence more fine grained explanations for the test images. Many of the parts that contradict/support a prediction do not make sense for me, especially when most of the image seems to contradict the prediction that was made or the whole image supports a prediction, etc. It might be that I am using the method wrong, or that my images are too small (maybe this influences segmentation?), or this only works for models with higher accuracy, … I don’t know yet but my conclusion is that it is not the simplest thing in the world to get meaningful explanations for predictions and you have be careful when using those explanations.
Final thoughts
I think the two main takeaways from this blog post are:
- Test or validation error is not always a good estimator of the error your model will make on new, unseen data. With image data, this can be due to the fact that images can be taken in many different ways and not every situation might be covered by your training set. The model might also be overfitting to something in the training data that is not present in the test data.
- Interpretability is not something that you achieve by simply running one of the available methods on your samples. In order to understand the explanation, you need to understand the method and how the explanations are computed. E.g. with image data, it seems to highly depend on the segmentation you use, which requires some knowledge about this topic. In my opinion, if you use the wrong segmentation, also the explanations might be misleading.
What are your thoughts on this?
I was also reading and thinking a bit about lime. The question that remains in my head is that there seems to be no guarantee that the Local Proxy learned by Lime corresponds at all to the original classifier.
I mean: Assume you have to sub sets of features s1 and s2 (while s1 & s2 is empty set) that equally well explain some dependent variable.
How you can make sure if your original model may have picked up s1 and the local one s2 (extreme example but I hope my point is clear?)
If that assumption is true, then LIME might not at all explain the models decisions.
You have some thoughts about that?
Hi Mereep!
Thanks for your interesting comment. I think I understand your question (although I don’t understand what you mean by “s1 & s2 is empty set”).
By how LIME works it cannot pick up something that is not picked up by the global model, since it does not get to see the training set (at least not the labels).
Let’s say, the training set looks like (very simplified):
s1 s2 y
1 -1 1
2 -2 2
-2 2 -2
A “correct” global model could be y = s1 or y = -s2. Right?
We’ll pick y=s1 as our model for now.
So if we apply LIME to it, and we want to explain the prediction f(s1=4, s2=-4) = 4, we will create perturbed samples (the obvious relationship between s1 and s2 is not taken into account) , e.g.
s1 s2
4 -3
3 2
1 0
In the next step, we ask the global model about it’s predictions, which will be: 4, 3, 1
Then we’ll train a linear model and it will easily pick up the relation ship y = 1*s1 + 0*s2.
This happens because changing s2 does not change the prediction of the global model and this is what the linear models use as their input.
I hope I am right and it is clear what I mean 🙂
And for my recent paper we modified LIME such that it will store the predictions by the linear model and the “right” values (by the global model) so that we can measure afterwards how “faithful” the linear model is to the global model (see https://github.com/expectopatronum/lime/blob/master/lime/lime_base.py#L29).