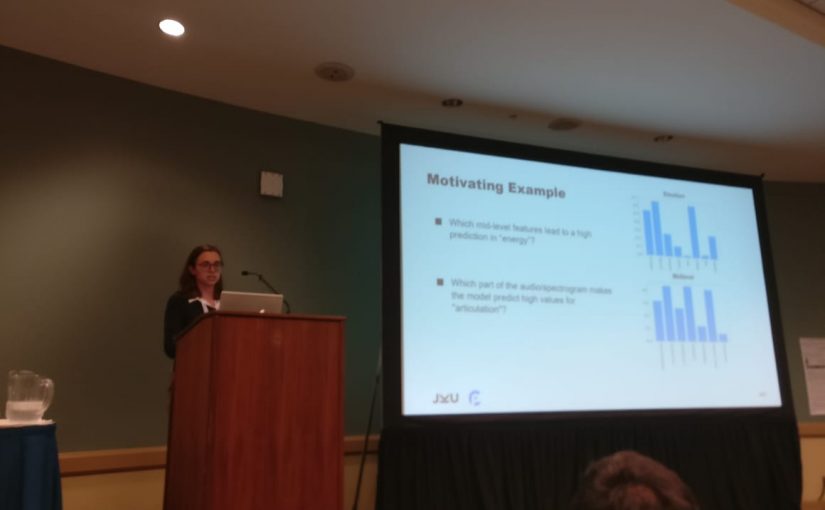
Last week my colleague and I spent a week at the ICML conference and presented our work at the Machine Learning 4 Music Discovery workshop. Public speaking is stressful for me, but you can prepare for it. What you can’t really prepare for are the questions afterwards. I thought of possible questions in advance – of course those were not asked 😉 But other very interesting questions I could not prepare for were asked. In such a situation I usually come up with quick, unsatisfying answers (at least to me). So I decided to adress the questions in more detail in this blog post.
I tried to transcribe the questions as good as I could from the recording of the talk.
Contents
Spectrogram-to-signal reconstruction
Q: I wonder which technique you use for the spectrogram-to-signal reconstruction?
A: I think this was already answered quite well by my colleague. To summarize: We can use the original phase of the original spectrogram (spec_stft). Then we compute the inverse of the used filterbank (spec_filterbank). In the next step we build the dot product between the spectrogram we want to reconstruct (spec_spectrogram – possibly modified) and the inverse filterbank.
For the inversion step we can use istft from librosa which takes a complex valued spectrogram (x_f) and returns the reconstructed audio signal (x_t).
def recon_audio(spec_stft, spec_filterbank, spec_spectrogram, out=None):
    original_phase = madmom.audio.stft.phase(spec_stft)
    fb_inv = np.linalg.pinv(spec_filterbank)

    spec_fb_inv = np.dot(spec_spectrogram, fb_inv)

    ph = np.exp(1j * original_phase)
    x_f = np.multiply(spec_fb_inv, ph)
    x_t = librosa.istft(x_f.T, hop_length=706)

    if out is not None:
        librosa.output.write_wav(out, x_t, 22050, norm=True)

    return x_t
You might wonder why we are using two different libraries (madmom and librosa) for working with spectrograms. When we first started with the project, we did not think of possibly inverting the spectrograms as part of our pipeline and started working with madmom. For the inverse STFT (to the best of my knowledge) we needed librosa. One of the first next steps will be to restructure our code base and replace madmom by librosa.
Attention maps instead of LIME
Q: I am wondering – one other approach you could use is like simply using a strong deep model that does classification and look at the layers and somehow visualize the attention map – how is this different than this approach?
A: Yes, using attention maps seems like a very nice approach for doing exactly what the person asked – this was also shown by one of the later presentations. But this is not what I am trying to do in my research (I was not clear about that – I admit). I plan to work on creating explanations for any model (called “post-hoc” explanations) and not interpretable models per se. The idea is that I can take models trained by someone else and try to interpret them. The main motivation behind this is I cannot force other researchers to use my cool interpretable model (like an attention model) to understand their inner workings, but I can apply my post-hoc method to see what some other model is doing.
Verify results using annotators
Q: One thing that could be interesting for emotion could be to put one of those things in front of annotators working with the subject to see what information they believe is still present in the signals – have you thought how you could do any of that to sort of verify what’s coming back?
A: As I said during the talk I think this is a great idea. But as we also know – and have heard during other talks – human annotations are expensive and time-consuming. What I did so far is to show the results to some people at my institute that have better musical knowledge than me and they helped me with evaluating the reconstructed signals.
Correlations between midlevel features
Q: I wonder if the midlevel representations you already start with labels – and also how much have you looked into possible correlations within these – because articulation could be quite related to – at least in the example you showed – to being rhythmic. So these things are quite correlated and there might be some structure you could exploit.
(I am not sure what the first part of the question means or if I understood it correctly from the recording – so I’ll answer the second part)
A: Correlation between mid-level features on the whole dataset can be found in the paper by Aljanaki. We only used the Soundtracks subset and I looked into the correlations for this blog post:
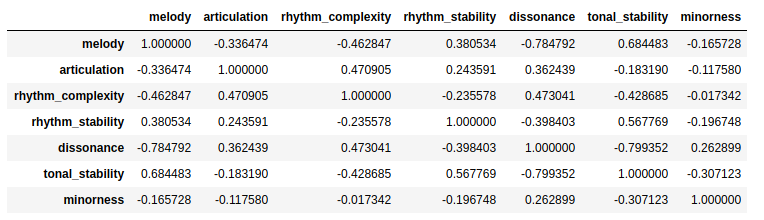
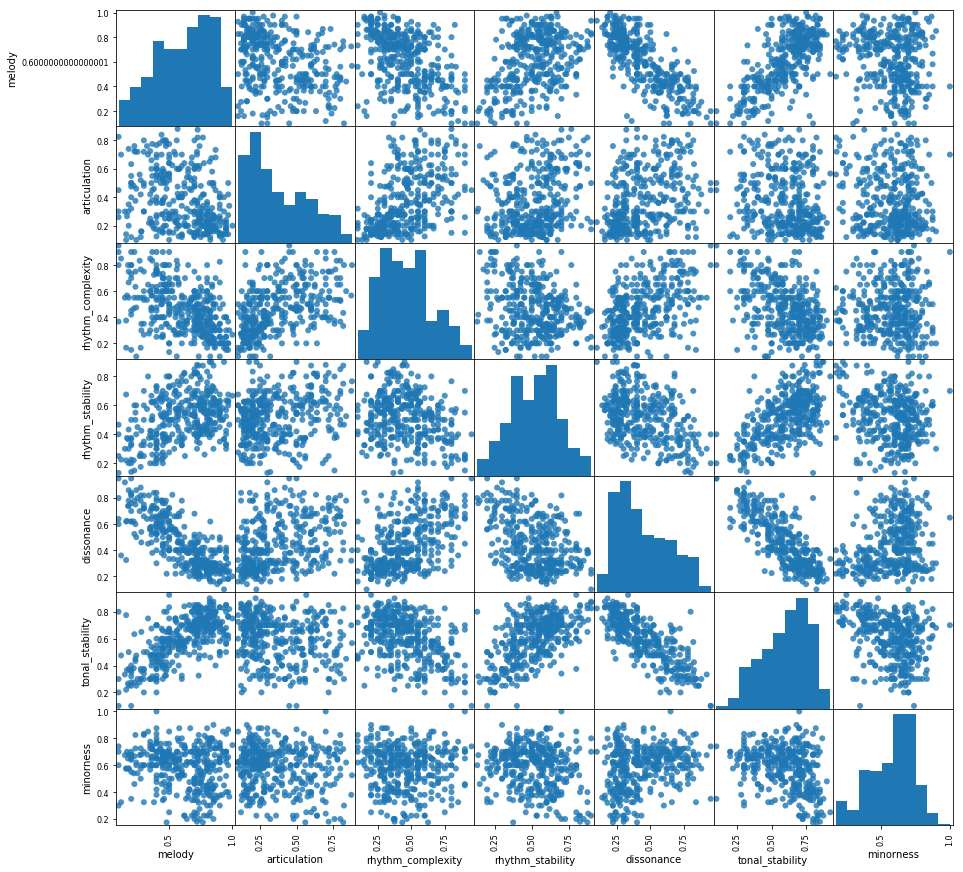
So yes, there are some correlations between the midlevel features and this of course has an impact on the modeling of the emotion values. We have also seen this in our experiments for our upcoming ISMIR 2019 paper (I’ll link to it once it is online). We looked at the correlations between midlevel features and emotion ratings and then at the feature weights learned by the linear layer. Without correlation between the input features one would expect the feature weights to look similar to the correlations between features and labels (“feature A is highly correlated with the target, so the feature weight for A should be positive and large”). Of course this is not the case when several features are correlated.
These correlations could be taken into account when modeling emotion but the point was to directly use the midlevel features in order to be able to analyze the linear weights. For interpretations I am not sure how the correlations between midlevel features could be taken into account – if you have an idea, just let me know!
Final words
I hope that this blog post answers questions about my paper and also helps understand better what I am trying to do and what my goals are (e.g., post-hoc explanations vs. building interpretable models). Looking forward to further dicussion. Check out our paper on arXiv!