Recently I wanted to visualise some data in a map of Austria. R Leaflet provides a pretty good looking map by default (openstreetmap.org) but I wanted to use basemap.at, which is a map for Austria and therefore probably the most accurate map available for Austria.
Actually it is not very difficult but it was the first time that I worked with such an interface and some points were confusing.
So, now there are two ways to do this:
- addProviderTiles(): with this you can tiles available at leaflet providers.
- addTiles(): this is more work but you can also add tiles that are not available in the list
Contents
About basemap.at
basemap.at provides 5 variants of the map of Austria.
- Standard
- Gray (not actually gray, but less color)
- Overlay (street names, …)
- High-DPI
- Orthofoto (maximum pixel resolution: 29cm)
You can have a look at the XML Interface. And they have a
demo app.
Easiest way: addProviderTiles()
This is the easiest way if the map you want is provided. The result is the same as for the more complicated way with addTiles() shown below.
leaflet() %>%
addProviderTiles(“BasemapAT.grau”) %>%
setView(16.3, 48.2, zoom=12)
addWMSTiles()
In a previous post I showed the first steps in QGIS using basemap.at. In QGIS I simply used the above linked XML file and thought this should also work using the method addWMSTiles() but it didn’t. If anyone has a working example, please share 🙂
addTiles()
In the XML I noticed a tag ResourceURL which reminded me of the ones that the method addTiles() is using.
Geoland Basemap
basemap von Österreich in Farbe
8.782379 46.358770
17.189532 49.037872
geolandbasemap
image/png
google3857
There are five such layers (one for each of the above mentioned maps).
At the beginning I couldn’t get it to work because I was not sure how to pass the link, although the openstreetmaps example works as expected. If you paste the following link into a browser you get a partial map (tile).
http://a.tile.openstreetmap.org/1/1/1.png
Remark: “a” is one of the available subdomains.
leaflet() %>% addTiles(urlTemplate = "http://{s}.tile.openstreetmap.org/{z}/{x}/{y}.png",
         attribution = NULL, layerId = NULL, group = NULL, options = tileOptions())
With a combination of the following links I figured out how it should work:
- How to use basemap.at withing Leaflet Maps Marker | mapsmarker.com
- How to use the official Austrian map basemap.at
- Leaflet.js TileLayer
It comes down to correctly defining this URL:
http://{s}.wien.gv.at/basemap/geolandbasemap/{Style}/{TileMatrixSet}/{TileMatrix}/{TileRow}/{TileCol}.png
At the beginning I thought that {s} was a type, so I removed it (proud of myself for finding a mistake…), but later found out that:
- {s} is the template for all subdomains available, in this case: maps, maps1, maps2, maps3, maps4
- {Style} is “normal” (can be found in the XML file)
- {TileMatrixSet} is “google3857” (also in the XML)
- {TileMatrixSet} is the zoom factor
- {TileRow} and {TileCol} are the x and y coordinates of the tile on the map
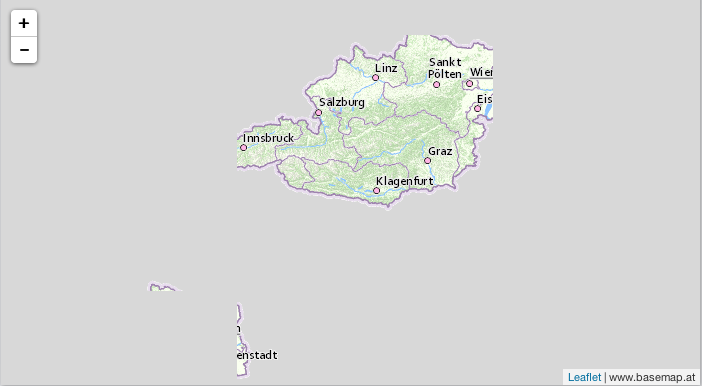
This is the same URL as I found in the first two links above, but since I had some other problems it didn’t work out at first and I tried around a lot. The mean thing is that I tried to follow the openstreetmap example above and they seem to have x and y the other way around (see the results at the bottom!).
Anyway, I came up with this link for the standard basemap (with slight variations for the other maps of course and take care of .png/.jpeg, that’s not the same for all).
http://{s}.wien.gv.at/basemap/geolandbasemap/normal/google3857/{z}/{y}/{x}.png
Source code
First I define the urls for all 5 maps.
geolandbasemap<-"http://{s}.wien.gv.at/basemap/geolandbasemap/normal/google3857/{z}/{y}/{x}.png"
bmapgrau<-"http://{s}.wien.gv.at/basemap/bmapgrau/normal/google3857/{z}/{y}/{x}.png"
bmapoverlay<-"http://{s}.wien.gv.at/basemap/bmapoverlay/normal/google3857/{z}/{y}/{x}.png"
bmaphidpi<-"http://{s}.wien.gv.at/basemap/bmaphidpi/normal/google3857/{z}/{y}/{x}.jpeg"
bmaportho<-"http://{s}.wien.gv.at/basemap/bmaporthofoto30cm/normal/google3857/{z}/{y}/{x}.jpeg"
For each map I call leaflet(), add the tiles using the URL, pass the subdomains as options and then "print" it (printing is only necessary if you assign it to a variable, otherwise it will render it right after calling the method).
Since Austria is very, very tiny, at the beginning you won't see anything. Therefore I use setView() (with a location close to my home and a zoom factor) to change the image section.
In the last map I use the ortho photo and the overlay together which is simply calling addTiles() again with the next layer.
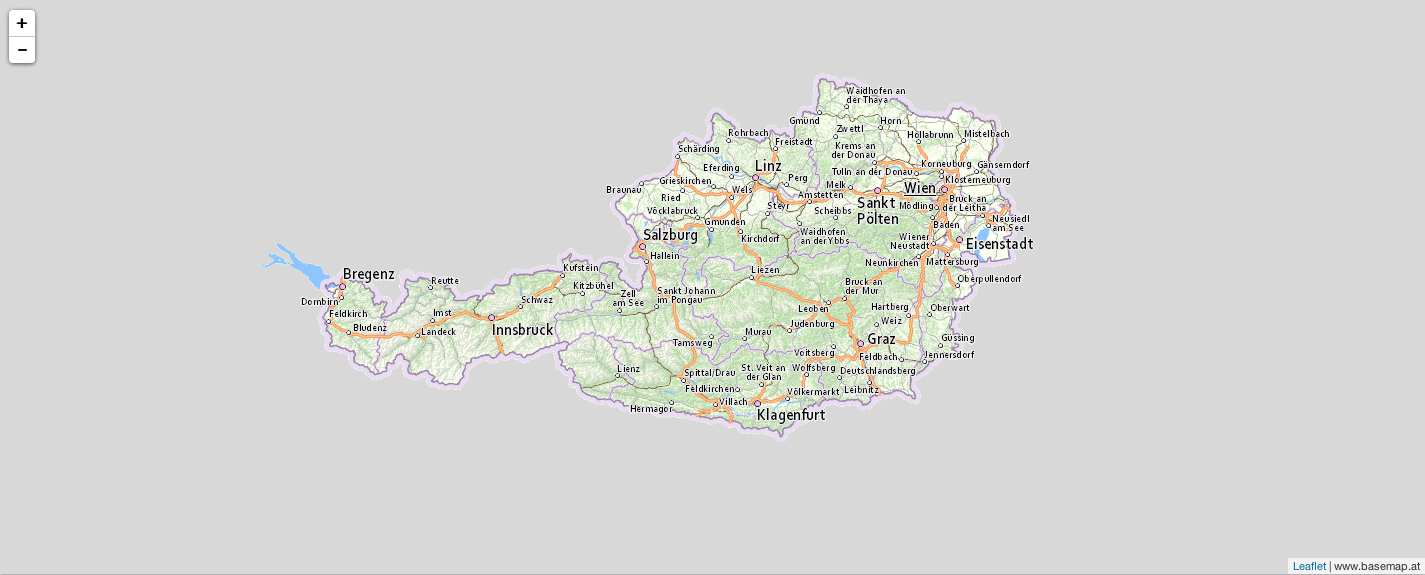
# standard
basemap<-leaflet() %>% addTiles(geolandbasemap,
options=tileOptions(minZoom=0, subdomains=c("maps","maps1", "maps2", "maps3", "maps4")),
attribution = "www.basemap.at")
print(basemap)
basemap %>% setView(14.62036, 48.32018, zoom = 12) # zoom to the mean location of my cats
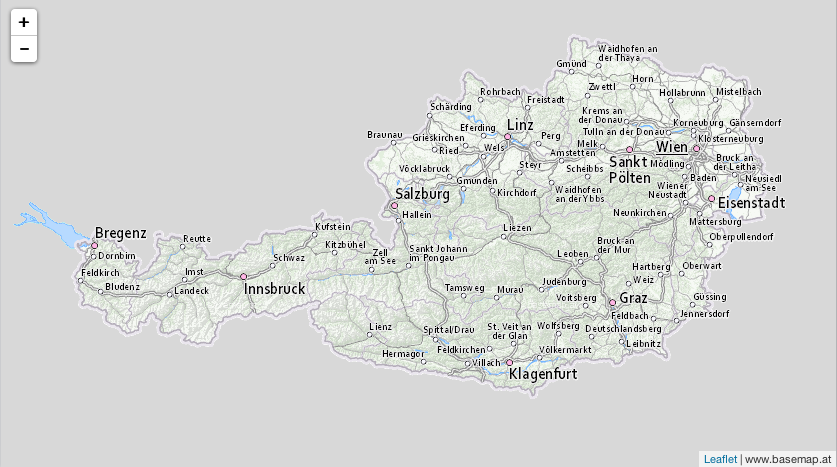
# gray
basemap<-leaflet() %>% addTiles(bmapgrau,
options=tileOptions(minZoom=0, subdomains=c("maps","maps1", "maps2", "maps3", "maps4")),
attribution = "www.basemap.at")
print(basemap)
# high dpi
basemap<-leaflet() %>% addTiles(bmaphidpi,
options=tileOptions(minZoom=0, subdomains=c("maps","maps1", "maps2", "maps3", "maps4")),
attribution = "www.basemap.at")
print(basemap)
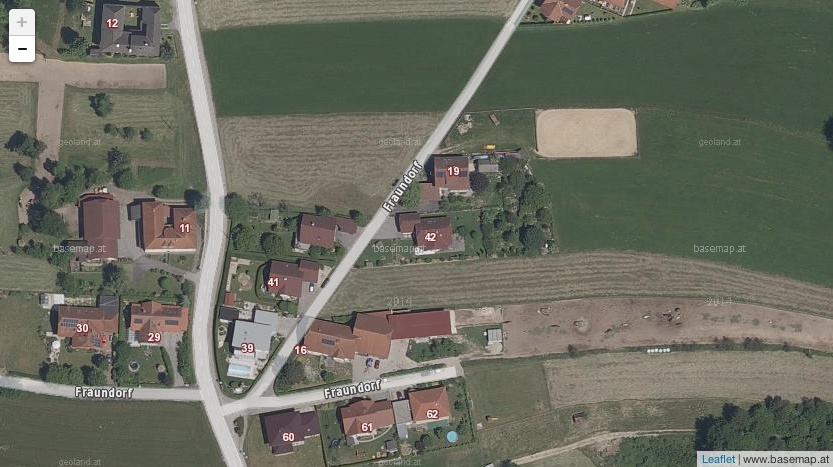
# ortho+overlay
basemap<-leaflet() %>% addTiles(bmaportho,
options=tileOptions(minZoom=0, subdomains=c("maps","maps1", "maps2", "maps3", "maps4")),
attribution = "www.basemap.at") %>%
addTiles(bmapoverlay,
options=tileOptions(minZoom=0, subdomains=c("maps","maps1", "maps2", "maps3", "maps4")),
attribution = "www.basemap.at")
print(basemap)
Results
Standard map
Gray
High-DPI
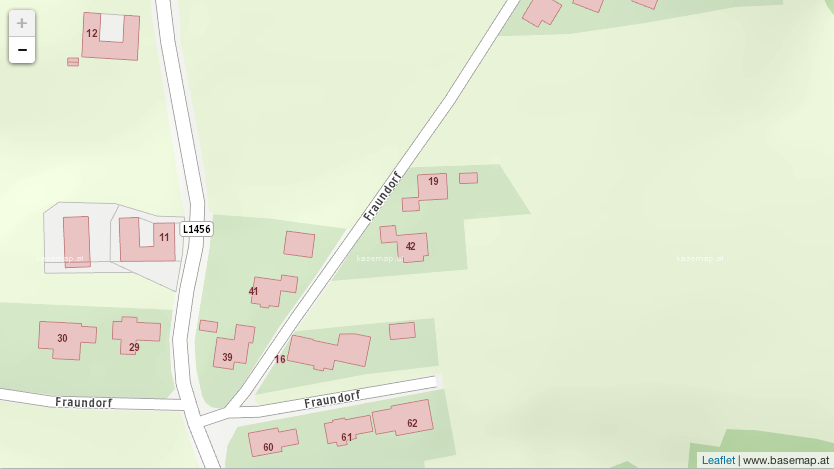
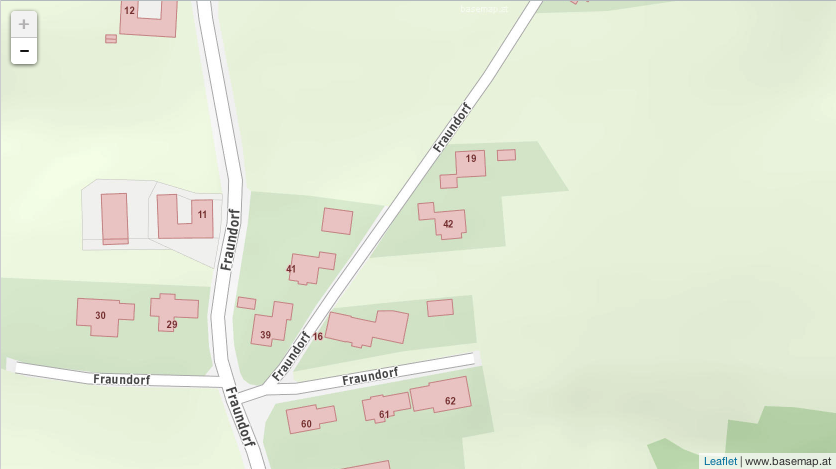
For me the two look the same and you also can't zoom closer. But the website also states that the high dpi map is useful for mobile devices and so on so maybe that's why I don't see any more resolution.
Orthofoto + Overlay
Blooper
This happens when you mix up x and y coordinates of a map!
Source code
The source code can also be found in my github repo 201601_basemap/basemap_leaflet.R.
A simpler way is to use addProviderTiles():
library(“leaflet”)
leaflet() %>%
addProviderTiles(“BasemapAT.grau”) %>%
setView(16.3, 48.2, zoom=12)
Here is a list of all providers: https://leaflet-extras.github.io/leaflet-providers/preview/