
About 2 weeks ago I received an invite to Google Inbox and since then I am thrilled how awesome emailing can be. In this post I want to show you the features that I like most (each of the 23 points is also documented in a screenshot). Inbox overview 1. “Pin”, “snooze” and “done” option … Continue reading Love at first sight: Google Inbox
Category: Tech & Science
![[Dimensionality Reduction #2] Understanding Factor Analysis using R](https://www.katzentante.at/wp-content/uploads/2015/05/feature_fa_colored.png)
[Dimensionality Reduction #2] Understanding Factor Analysis using R
This time I am going to show you how to perform Factor analysis. In the next post I will show you some scaling and projection methods. The idea for this mini-series was inspired by a Machine Learning (Unsupervised) lecture I had at university. I will perform all this methods on the same data sets and … Continue reading [Dimensionality Reduction #2] Understanding Factor Analysis using R
![[Dimensionality Reduction #1] Understanding PCA and ICA using R](https://www.katzentante.at/wp-content/uploads/2015/05/pca_ica.png)
[Dimensionality Reduction #1] Understanding PCA and ICA using R
This time I am going to show you how to perform PCA and ICA. In the next one or two posts I will show you Factor Analysis and some scaling and projection methods. The idea for this mini-series was inspired by a Machine Learning (Unsupervised) lecture I had at university. I will perform all this … Continue reading [Dimensionality Reduction #1] Understanding PCA and ICA using R
Basic handling of spatial data (like GPS coordinates)
This week I am going to show you some very basic things you can do with GPS coordinates. In this post you will learn how to: Read gpx files Read files containing plain text coordinates (like N 48 12.123 and N 48 12′ 123″) Parse characters string that contain unformatted coordinates (like above) Convert minute … Continue reading Basic handling of spatial data (like GPS coordinates)
How to choose the correct plot for your data
Today I am going to talk about how to choose the correct representation for several types of data. From statistics class you might remember there are three types of data: Metric (data can be measured or counted, mathematical operations make sense) Ordinal (data can be ordered in a meaningful way, but mathematical operations (+, -, … Continue reading How to choose the correct plot for your data
How to handle factors in R
Many people seem to have a problem with factors. This might be because factors do not always behave like you expect them to. Factors are vector like objects, but the items can only take certain values. This post gives a very basic introduction to factors. Introduction and usage Factors can be created from vectors. chr.v … Continue reading How to handle factors in R
Info graphic for R plotting parameters
Do you always have to look up the numbers of plotting symbols or lines? I do and that is why I created an info graphic that summarizes these parameters and also some color functions. You can download this graphic here. The numbers on the axes give the value used for pch and lty according to … Continue reading Info graphic for R plotting parameters
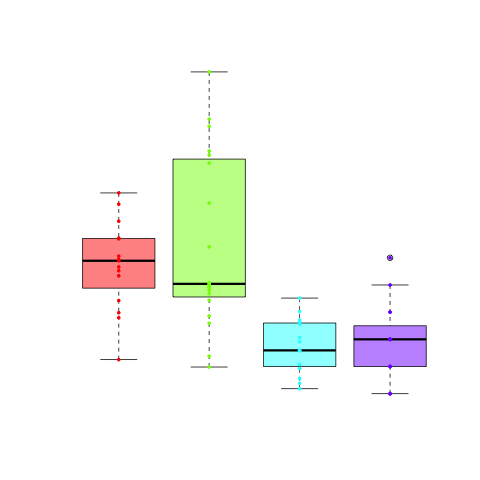
Create boxplots in R
My favorite plots are boxplots, because you have a lot of information in them. If you look at a very basic boxplot, you can see the median (bold line), the quartiles (upper and lower boundary of the box) and if there are outliers (by default those are values that are 1.5 times the boxlength away … Continue reading Create boxplots in R
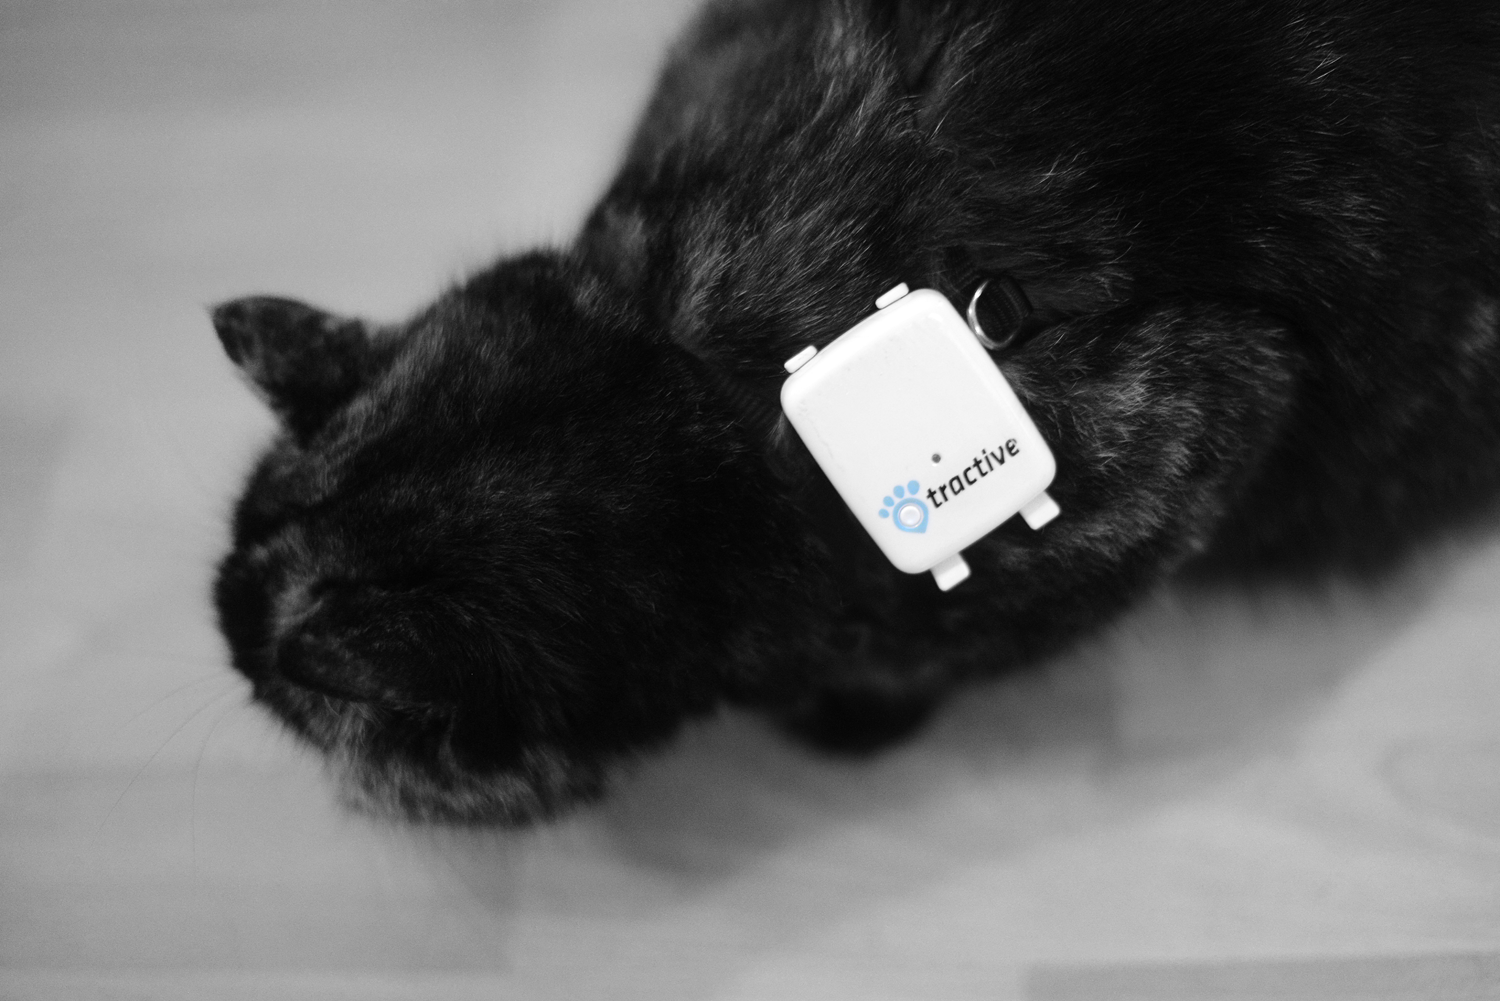
Tractive GPS Pet Tracking
Last christmas I received the most amazing gift ever: A GPS Pet Tracking device developed by the company Tractive. This company is located in Pasching (Upper Austria), which I found out when I first opened my present. The GPS Pet Tracking device is an item that allows you to live track your pets. The tracker … Continue reading Tractive GPS Pet Tracking