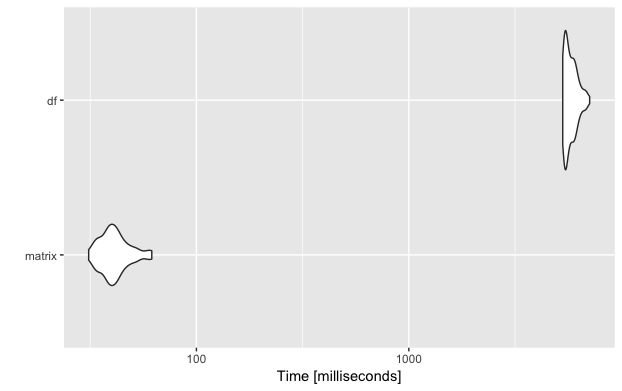
Just a few days ago I stated the following on Twitter: Just reduced the runtime of an algorithm from 9 hours to 3 min. by using a different data structure… Know you data structures 🙂 #rstats — Verena Haunschmid (@ExpectAPatronum) May 1, 2017 Since my tweet has been liked and shared a lot, I thought … Continue reading Know your data structures!
Tag: data
Presentation “R for Data Science”
Some weeks ago I had a presentation at my work place about “R for data science” that I’d like to share with you. I’ve written the slides in R and rmarkdown and uploaded them to rpubs.com. I chose to use rmarkdown for my slides although we have great company PowerPoint templates, because I wanted to … Continue reading Presentation “R for Data Science”

Accessing your Fitbit data
Since I am a data junkie and bought my Fitbit Charge HR mainly because I wanted to collect and analyse data about myself, I was looking for ways to download the data to my computer. For most people the great stats overview in the app and in the online dashboard will be sufficient but some … Continue reading Accessing your Fitbit data

Finding data sets PART 3: Weather, geographical and government data
This is the third post in my dataset series. The first part gave a more general overview on where to get data. In the second post I listed sources for sports, movies, music and books data. This section will give you information on how to get weather, public/governmental data and how to find GIS data. … Continue reading Finding data sets PART 3: Weather, geographical and government data
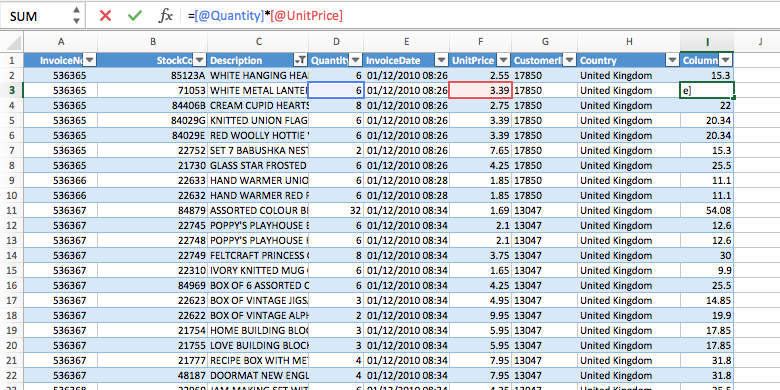
Data Analysis with Microsoft Excel: Tables
Auf ambassadorbase.at ist mein Artikel auf Deutsch verfügbar. In my job and my studies I recently finished I work with lots of different data sources and you will also meet all of them throughout your career as a data scientist. Data can be given to you as an SQL dump, XML files and many other … Continue reading Data Analysis with Microsoft Excel: Tables

Finding data sets Part 2: TV, music, book ratings and sports data
The first part gave a more general overview on where to get data. This section will give you specific data sources, e.g. if you like sports, movies, books, … and so on. Over the next couple of weeks you’ll find these posts on my blog: General data sources TV, music, book ratings and sports data … Continue reading Finding data sets Part 2: TV, music, book ratings and sports data
Finding data sets Part 1: General data sources
I often encounter interesting algorithms or R packages which I want to test. The nice ones provide data for testing but often it is only dummy data. To get a good understanding of the method and its limitations real data might be required. Sometimes I would also like to explore data I have not used … Continue reading Finding data sets Part 1: General data sources
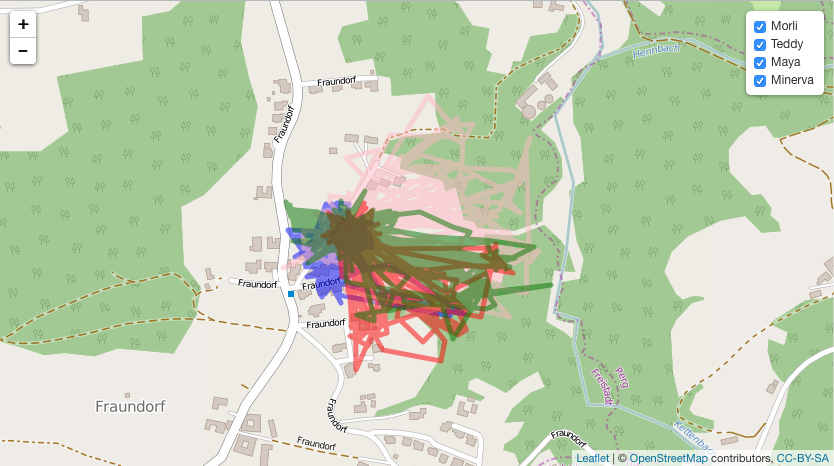
Cat tracking data collected with my Tractive GPS Pet Tracker
For about one year I have used the Tractive Pet Tracker to track my families (and my) cats, my grandmothers cats and our road trip to Sweden (German). Now I want to share that cat tracking data and some additional data with you. In this post I will Share the raw data with you Filter … Continue reading Cat tracking data collected with my Tractive GPS Pet Tracker

Use rvest to scrape NFL weather data
If you are following my progress in the Data Science Learning Club you might know that I am using NFL data for the tasks. For predicting sports events I think it is not only important to have statistics about the players, teams and previous games but also about the weather. From when I was a … Continue reading Use rvest to scrape NFL weather data
![[Dimensionality Reduction #2] Understanding Factor Analysis using R](https://www.katzentante.at/wp-content/uploads/2015/05/feature_fa_colored.png)
[Dimensionality Reduction #2] Understanding Factor Analysis using R
This time I am going to show you how to perform Factor analysis. In the next post I will show you some scaling and projection methods. The idea for this mini-series was inspired by a Machine Learning (Unsupervised) lecture I had at university. I will perform all this methods on the same data sets and … Continue reading [Dimensionality Reduction #2] Understanding Factor Analysis using R