For about one year I have used the Tractive Pet Tracker to track my families (and my) cats, my grandmothers cats and our road trip to Sweden (German). Now I want to share that cat tracking data and some additional data with you.
In this post I will
- Share the raw data with you
- Filter data (separate tracks for each cat and our vacation)
- Share the filtered data with you
- Show how to create a map (using leaflet) of our vacation
- Create a map with a track for each cat
I also wrote a blog post for Revolution Analytics, showing how to create a map with different tracks for each month.
Contents
The data
As already mentioned the data was collected using the tracker from the company Tractive.

Data can be downloaded from their website in gpx or kml format when you have a premium subscription. I used the gpx format.
Such a file looks like this:
Generated by Tractive Platform Service Tracker LJWSIZUT, 2016-01-08T08:37:33+00:00 2016-01-07T23:19:26Z 427 speed: 0.5 394 64 speed: 3.8
Since the tracker does not save which cat is wearing the tracker (although you can select it in the phone app), I took notes in an Excel sheet.
Reading the data
In a previous post I already showed how you can read gpx data like from my Pet Tracker. I updated my method to comply with a recommendation I found in this great article (library vs. require). I also converted the time column to a date to be able to compare it.
You need to install these libraries:
- XML
- plyr
readTrackingFile<-function(filename) {
  library(XML)
  library(plyr)
  xmlfile<-xmlParse(filename)
  xmltop<-xmlRoot(xmlfile)
  tracking<-ldply(xmlToList(xmltop[['trk']][['trkseg']]), function(x) {
    data.frame(x)
  })

  tracking<-data.frame("ele"=tracking$ele[seq(1, nrow(tracking), 2)], "time"=as.character(tracking$time[seq(1, nrow(tracking), 2)]),"lat"=tracking$.attrs[seq(1, nrow(tracking), 2)], "lon"=tracking$.attrs[seq(2, nrow(tracking), 2)])

  tracking$ele<-as.numeric(levels(tracking$ele))[tracking$ele]
  tracking$lat<-as.numeric(levels(tracking$lat))[tracking$lat]
  tracking$lon<-as.numeric(levels(tracking$lon))[tracking$lon]

  time_pattern<-"%Y-%m-%dT%H:%M:%SZ"
  tracking$time<-strptime(as.character(tracking$time), time_pattern)
  #x<-strptime(as.character(tracking$time), "%Y-%m-%dT%H:%M:%SZ")
  tracking$min<-60*tracking$time$hour + tracking$time$min

  message(paste("read", nrow(tracking), "tracking points"))

  return(tracking)
}
After a first look at the data I saw that there were two points with a latitude < 30, which would be somewhere south from South Africa and I know that I wasn't there and I hope neither were my cats ;) So I removed them.
track<-readTrackingFile("../../data/LJWSIZUT.gpx")
plot(track$lon, track$lat, pch=19, cex=0.5) # showed that some were far off
track<-track[track$lat > 30,]
Analyse our vacation
To get only the track for our vacation I took everything that was between start and end time of our travel.
time_pattern<-"%Y-%m-%dT%H:%M:%SZ"
vacation_start<-strptime("2015-07-23T05:00:00Z", time_pattern)
vacation_end<-strptime("2015-08-04T22:00:00Z", time_pattern)
track_vacation<-track[track$time>vacation_start & track$time<vacation_end,]
track_vacation<-track_vacation[!is.na(track_vacation$min),]
write.csv(track_vacation, file="../../data/track_vacation.csv", row.names=FALSE)
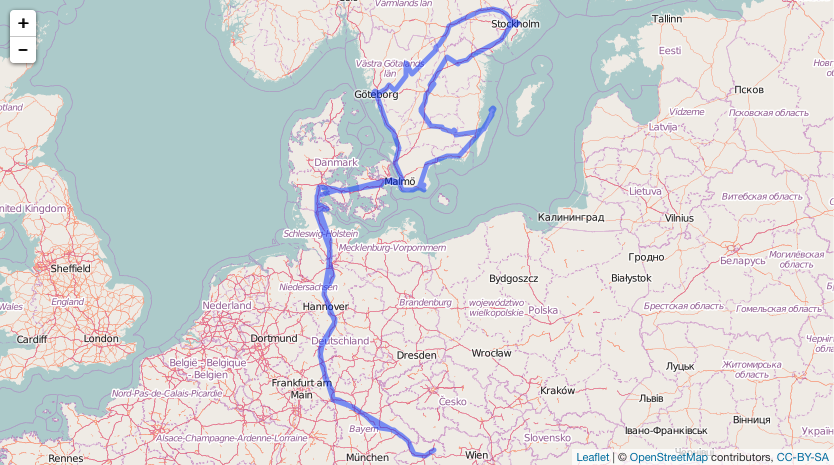
Leaflet map of our vacation
Therefore we need the library leaflet which can be installed from github.
library(devtools)
devtools::install_github("rstudio/leaflet")
library(leaflet)
The next piece of code shows how you create a standard map, fit the bounds to your data and add lines for a track.
myMap <- leaflet() %>% addTiles()
myMap  # a map with the default OSM tile layer
myMap %>% fitBounds(min(track$lon), min(track$lat), max(track$lon), max(track$lat))
myMap %>% addPolylines(track_vacation$lon, track_vacation$lat)
Cat tracking data: visualisations
To prepare the cat tracking data I selected everything that did not happen during our holiday. To match my cats to each track I had to read my Excel file (for which I highly recommend the xlsx package). For some days I didn't take notes which cat had the tracker, so I added another category "Unknown".
track_cat<-track[track$timevacation_end,]

# prepare cats
cats<-read.xlsx("../tractive/data/Katzen1.xlsx", sheetIndex=1, header=FALSE, stringsAsFactors = FALSE)
names(cats)<-c("TrackingDate", "Cat")
cats<-cats[!is.na(cats$Cat),]
time_pattern<-"%d. %B %Y"
cats$TrackingDate<-strptime(paste(cats$TrackingDate, "2015"), format = time_pattern)

# add cat name
track_cat$cat<-"Unknown"
for (i in 1:nrow(track_cat)) {
  cat_idx<-which((cats$TrackingDate$mday == track_cat[i,"time"]$mday)
                 & (cats$TrackingDate$mon+1 == track_cat[i,"time"]$mon+1)
                 & (cats$TrackingDate$year+1900 == track_cat[i,"time"]$year+1900))
  if (length(cat_idx) == 1) {
    track_cat[i,"cat"]<-cats[cat_idx, "Cat"]
  }
}

# remove NA

track_cat<-track_cat[!is.na(track_cat$lon),]
summary(track_cat[,c("lon","lat")])
summary(track_cat[abs(track_cat$ele-423)<30,c("lon","lat")])
write.csv(track_cat, file="../../data/track_cat.csv", row.names=FALSE)
write.csv(track_cat_clean[track_cat_clean$cat!="Unknown",], file="../../data/track_cat_clean.csv", row.names=FALSE)

col<-c("gray", "blue", "pink", "red", "green")
mycats<-unique(track_cat$cat)
To create a map with different tracks you can simply loop over them. I added the group parameter so that I can later add checkboxes to activate/deactivate single tracks.
catMap<-leaflet() %>% addTiles()
for (i in 1:length(mycats)) {
  cat<-mycats[i]
  catMap<-catMap %>% addPolylines(track_cat[track_cat$cat==cat,"lon"], track_cat[track_cat$cat==cat,"lat"], col=col[i], group=cat)
}

print(catMap)
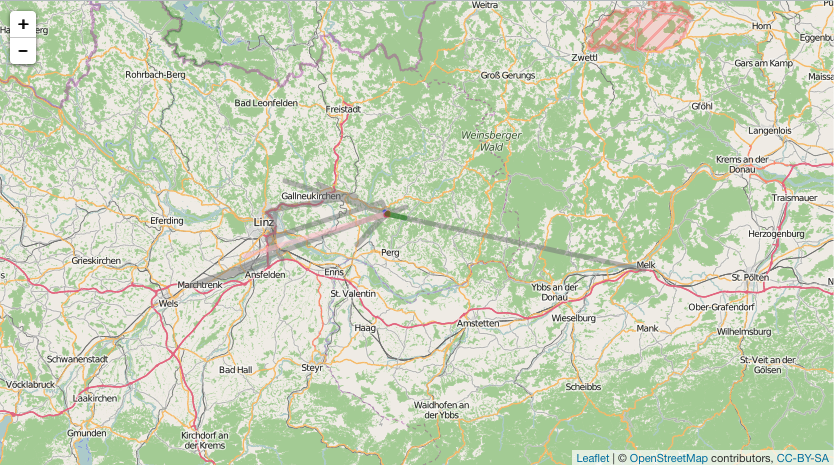
After that I saw that probably some more data was wrong. My theory was that at times when the tracker sent a wrong location (because it was just turned on or some other disturbance) the elevation must also be wrong. So I took the median elevation of 423 and removed every data point that deviated further than 30 meters. There might be more sophisticated ways to do this but it seemed to work.
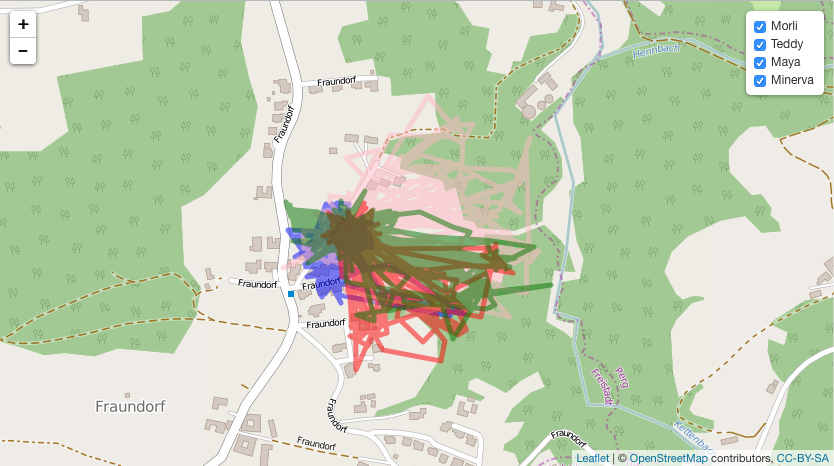
I also removed all points that I could not assign to a cat, because they just added unnecessary noise to the map.
The last few lines show how to add the above mentioned checkboxes. Now I can also select/unselect cats and look at each one separately. I think you can see very well that each of the four cats has certain areas where they go a lot. I think that's really, really cool 🙂
track_cat_clean<-track_cat[abs(track_cat$ele-423)<30,]

catMap<-leaflet() %>% addTiles()
for (i in 1:length(mycats)) {
  cat<-mycats[i]
  if (cat != "Unknown") {
    catMap<-catMap %>% addPolylines(track_cat_clean[track_cat_clean$cat==cat,"lon"], track_cat_clean[track_cat_clean$cat==cat,"lat"], col=col[i], group=cat)
  }
}

catMap %>%
addLayersControl(
  overlayGroups = mycats[2:5],
  options = layersControlOptions(collapsed = FALSE))
The data
All the data is stored in my github repo.
The source code is also available in my github repo.
Thanks for sharing this information about gps pet tracker